You're looking at a monthly profit and loss statement, but the numbers don't explain themselves. Revenue missed the plan, payroll ran higher, and expenses moved in several directions. Variance analysis reporting compares actual results with a budget, forecast, or prior period, then explains the meaningful differences so an owner can decide what to investigate, correct, or ignore. The useful report isn't a spreadsheet full of red and green cells. It's a short decision tool that separates operating signals from timing noise.
Table of Contents
- What Is Variance Analysis Reporting and Why Owners Need It
- How to Calculate Dollar and Percentage Variances Step by Step
- Which Variances Actually Matter Enough to Investigate
- What a Monthly Variance Analysis Report Should Include
- Variance Analysis Reporting Examples for Real Estate Nonprofits and Trades
- Common Pitfalls and Quick Fixes for Better Variance Reports
What Is Variance Analysis Reporting and Why Owners Need It
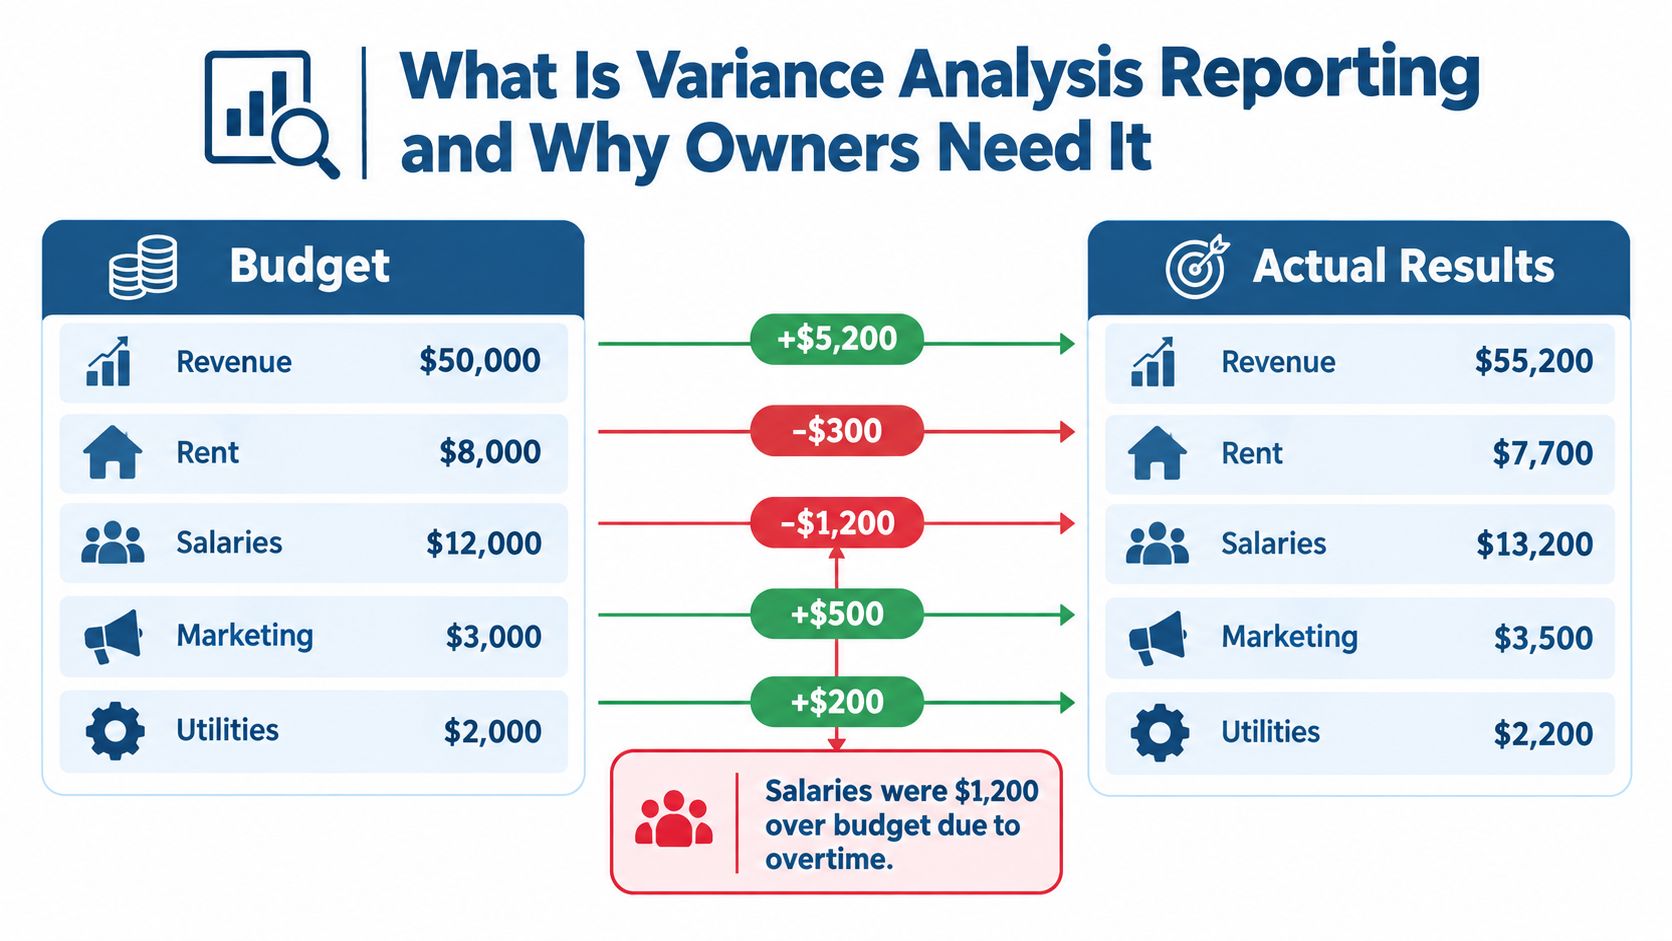
A contractor reviews the monthly results and sees strong revenue, yet profit is falling. Labor hours, material purchases, or subcontractor charges have moved faster than sales. Variance analysis reporting is a side-by-side review of actual financial results against a chosen baseline, paired with a plain-English explanation of what changed and why. It gives an owner-operator a practical way to triage the numbers without a full FP&A team. The method applies to revenue, expenses, profit, cash flow, and balance sheet accounts. The standard process, including setting standards, recording actual results, calculating variances, investigating significant differences, and acting on findings, is outlined in these management accounting course notes.
Use four repeatable steps:
- Set the baseline. Choose a budget, forecast, prior month, prior quarter, or the same period in the prior year. The comparison must answer a real question. A budget comparison tests plan performance, while a prior-year comparison can reveal seasonality.
- Capture actuals. Close the books far enough that unpaid bills, payroll, deposits, inventory, and reclassifications do not distort the period.
- Compute the gap. Calculate the dollar and percentage difference for each relevant line.
- Explain the cause. Identify what changed, why it changed, whether it is temporary, and what action follows.
Why the report belongs in the owner's monthly routine
A financial statement shows the result. A variance report connects that result to operations. A revenue shortfall may come from fewer jobs, lower pricing, customer mix, or an invoice posted in the wrong month. Each cause requires a different response, so the report should record the cause rather than merely highlight the line in red.
Use management by exception to keep the monthly review efficient. Investigate large, unusual, or recurring movements first. Treat small timing differences as noise when they have no effect on decisions, but document them when they could distort cash, tax projections, or the next close. Owners can strengthen the underlying process by following these financial reporting best practices.
The report earns its place in the routine when every meaningful variance answers three questions: what happened, why did it happen, and who will act? A contractor with healthy top-line revenue can still lose margin when labor hours, materials, or subcontractor costs drift. Reviewing the pattern each month exposes the problem before a year-end total conceals it.
Practical rule: Every material variance should end with an owner, an explanation, and a next action. If it has none of those, it is only a calculation.
How to Calculate Dollar and Percentage Variances Step by Step
Start with three inputs for each line item: the budgeted amount, the actual amount, and the comparison baseline. You might compare actual results with budget, one month with another month, or the current year with the prior year. Pick the baseline first, because the same actual result can look favorable against one comparison and unfavorable against another.
The basic calculations are:
- Dollar variance = Actual amount minus Budget amount
- Percentage variance = Dollar variance divided by Budget amount, expressed as a percentage
The dollar result shows the absolute financial effect. The percentage result shows proportional movement, which helps identify drift on smaller lines. Never read the percentage without the dollar amount. A large percentage on a small expense may be less urgent than a modest percentage on payroll or gross profit.
Worked example
Suppose a business budgeted revenue of $100,000 and recorded $120,000 in actual revenue. The dollar variance is $20,000 favorable, and the percentage variance is 20 percent favorable. For a cost line, budgeted expense of $50,000 compared with actual expense of $58,000 creates an $8,000 unfavorable variance and a 16 percent unfavorable variance.
| Line Item | Budget | Actual | Dollar Variance | Percentage Variance | Favorable / Unfavorable |
|---|---|---|---|---|---|
| Revenue | $100,000 | $120,000 | $20,000 | 20 percent | Favorable |
| Operating cost | $50,000 | $58,000 | $8,000 | 16 percent | Unfavorable |
The favorable or unfavorable label depends on the type of account. Higher revenue is generally favorable, while higher cost is generally unfavorable. For expenses, an actual amount below budget is commonly favorable. Historical standard-costing materials describe the same distinction, where actual cost below standard is favorable and actual cost above standard is unfavorable, using the identity variance = actual costs minus standard costs, as explained in this management accounting chapter.
A percentage variance can mislead when the budget is very small or zero. In those cases, use the dollar amount and a written explanation instead of forcing a percentage that doesn't communicate anything useful. For costs tied to production or service delivery, you can also break the total into price, quantity, and volume components. That decomposition links the accounting result to purchasing, staffing, usage, or sales activity, as outlined in this cost and management accounting unit.
Which Variances Actually Matter Enough to Investigate
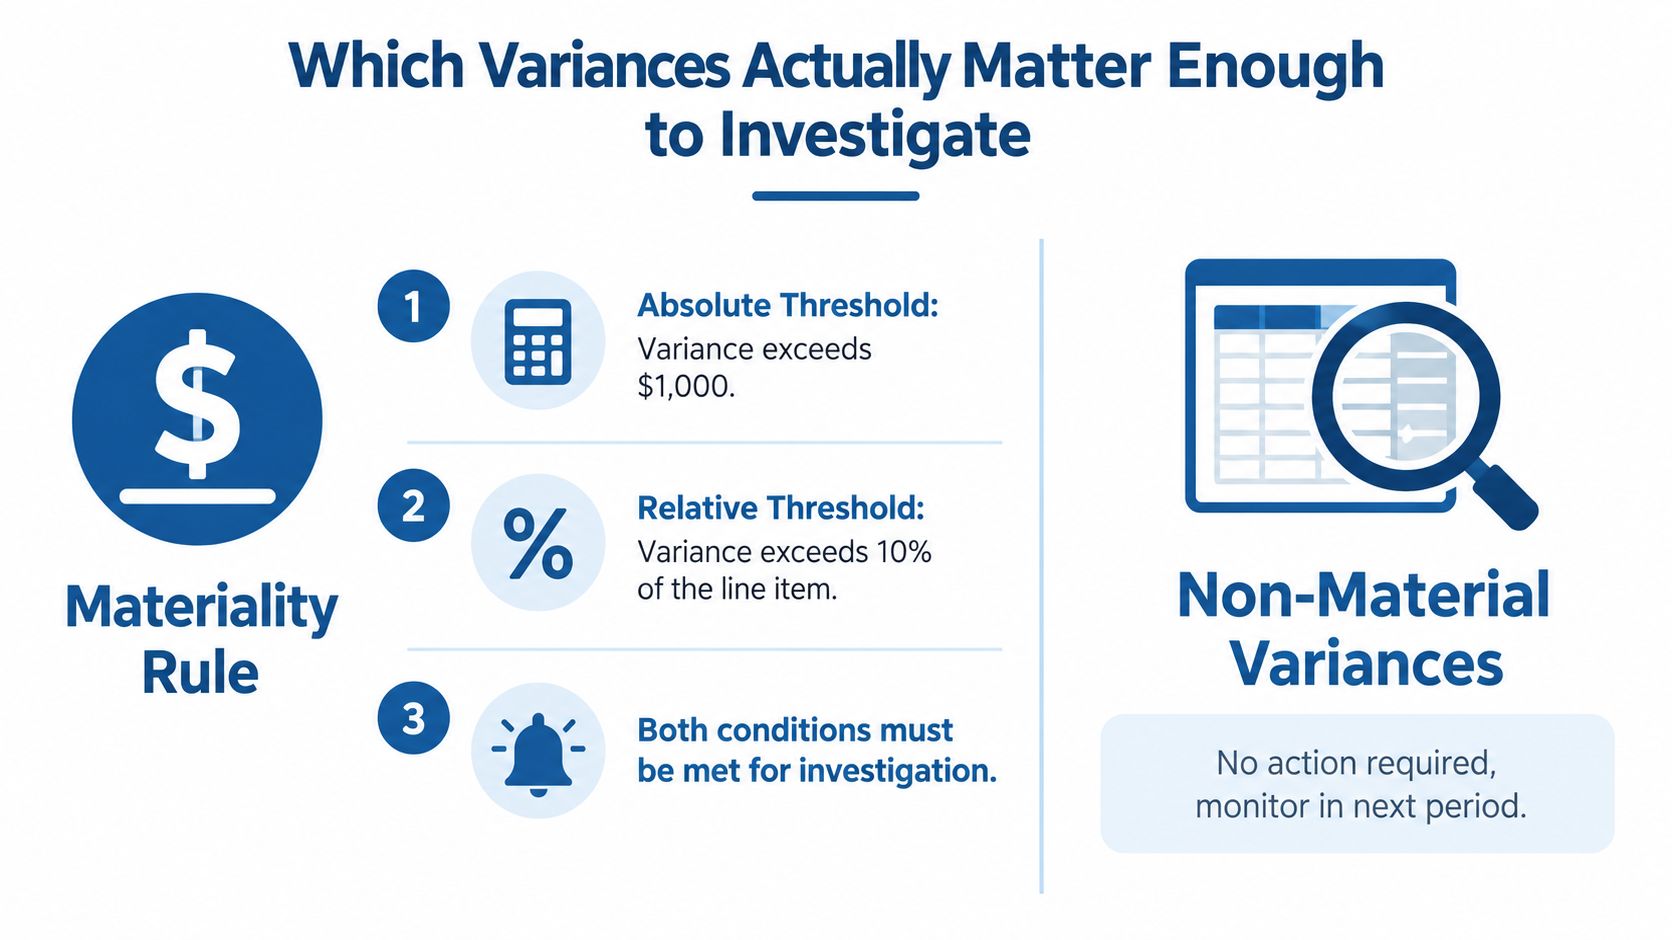
The owner's monthly review starts with triage. A $200 fluctuation in office supplies should not receive the same attention as a payroll shortfall or a drop in gross profit. Set a materiality rule before reviewing the report: investigate a variance only when it exceeds $1,000 absolute and 10 percent of the line item. Review critical lines separately, including gross profit, payroll, and key cost-of-sales accounts.
Treat that rule as a filter, not an accounting requirement. Adjust it for the business's size, risk, and reporting needs. Variance reporting should explain the specific drivers behind quarterly and year-end results, compare the current period with the same period in the prior year, and compare balance sheet accounts with the prior year-end position. See the variance analysis standards discussion.
Classify the cause before choosing the response
A flagged amount needs a cause and an owner, not just a label. Sort it into one of four categories:
- Price: A vendor raised rates, a subcontractor charged more, processor fees changed, or the business changed its selling price.
- Volume: The business completed fewer jobs, sold more units, served fewer customers, or operated at a different occupancy level.
- Timing: An invoice posted in another period, a seasonal shift occurred, or a prepaid cost was released earlier or later than planned.
- Mix: Customers, products, projects, or services changed, affecting average margin even when total activity appeared acceptable.
The category determines the response. A price variance calls for vendor negotiation or a pricing review. A volume variance belongs with sales or operations. A timing variance usually needs a footnote and a later check, not an immediate cost-cutting decision. A mix variance requires an assessment of which work the business accepts.
End every flagged line with one decision:
- Investigate: The cause is unclear, recurring, or financially meaningful.
- Monitor: The cause is understood, but another period is needed to confirm the pattern.
- Ignore: The difference is immaterial and has no meaningful operational consequence.
Use this embedded variance analysis training video as a visual supplement. Account-level review still determines the action.
What a Monthly Variance Analysis Report Should Include
An owner opens the monthly report after a weak sales month and needs to decide whether to cut spending, raise prices, or wait for a timing issue to clear. The report should answer that question quickly. Put total revenue, total expense, and net income variances against budget and prior year on the first page, then list the three to five drivers that require attention. If the owner must search through exports to find the main issue, the report is too dense.
Build the package from summary to source
Start with a KPI dashboard that shows operating direction. Use gross margin, operating margin, cash conversion, and headcount. Follow it with an income statement showing each line item's budget, actual result, dollar variance, percentage variance, and favorable or unfavorable status.
Give cash flow its own section. A profitable month can still produce weak cash when receivables rise, inventory absorbs funds, or bills are paid earlier than expected. Connect operating changes with working capital movements so the owner can see why earnings and cash moved differently.
Keep supporting detail in the appendix. Include department or project results, capital expenditures compared with depreciation, and notes for one-time items, reclassifications, and timing differences. Businesses still establishing basic reporting should first create a reliable profit and loss statement process.
| Section | Purpose | Key Contents |
|---|---|---|
| Executive summary | Direct attention to decisions | Revenue, expense, net income, top drivers, escalations |
| KPI dashboard | Show operating direction | Gross margin, operating margin, cash conversion, headcount |
| Income statement variance | Explain profit movement | Budget, actual, dollar variance, percentage variance, status |
| Cash flow variance | Connect earnings to cash | Operating changes, working capital, collections, payments |
| Appendix | Support review and follow-up | Departments, projects, capital expenditures, depreciation, notes |
Use the same column order every month and provide a clear drill-down path. From a flagged total, the owner should reach the relevant department, project, vendor, or transaction without rebuilding the analysis manually. That structure turns the report into a decision tool rather than a static accounting package.
Make commentary short and specific
Every explanation should state what moved, why it moved, and what happens next. “Payroll was unfavorable because overtime increased during the expansion project. The operations manager will review scheduling before the next close” gives the owner a decision and an owner. “Payroll was higher than expected” gives neither.
Balance sheet reporting needs the same discipline. Separate current-quarter year-to-date results from the same quarter year-to-date in the prior year. For balance sheet accounts, also show the prior year-end position. This comparison helps separate timing, seasonality, and balance movement from underlying operating performance. Follow established reporting guidance, but keep the commentary focused on the action the owner must take.
Variance Analysis Reporting Examples for Real Estate Nonprofits and Trades
The same triage method works across industries, but the meaningful lines differ. A landlord focuses on occupancy, repairs, and capital classification. A nonprofit focuses on restricted revenue and program spending. A trades contractor focuses on job margin, materials, labor efficiency, and project mix.
| Business Type | Key Variance Driver | Owner Action |
|---|---|---|
| Residential rental portfolio | Vacancy and repair classification | Review leasing, separate repairs from capital work, update property forecasts |
| Nonprofit program | Overtime and grant spending | Review staffing plan, document grant coverage, monitor travel and personnel |
| Trades contractor | Materials pricing and crew efficiency | Reprice open work, review purchasing, analyze job-level labor deployment |
Residential rental portfolio
A residential rental owner with a five-unit portfolio finds that two units were vacant, leaving rental income 18 percent below budget. Repairs were 32 percent over budget because of a roof replacement that should have been capitalized rather than treated as a period repair. The owner's next steps are to review leasing activity, separate the roof work from ordinary repairs, and update the property-level forecast so vacancy and capital needs are visible.
The key lesson is classification. The income shortfall requires an occupancy and leasing response. The repair variance requires an accounting review before the owner concludes that ordinary maintenance costs are structurally out of control.
Nonprofit program
A nonprofit compares restricted grant revenue with its budget and finds that personnel costs are 9 percent unfavorable because a program expansion created unbudgeted overtime. Lower travel costs partially offset the personnel movement. Management reviews staffing coverage, confirms that the overtime is allowable under the relevant grant terms, and adds a written explanation to the close package.
The report shouldn't label lower travel as an automatic success. The organization needs to ask whether travel declined because the team found a better delivery method or because planned program activity didn't happen.
Trades contractor
A trades contractor reviews margin by project and finds that materials were 14 percent over budget on two jobs after lumber price spikes. A third job shows a crew mix inefficiency that lowered expected margin even though its materials were controlled. The contractor reviews purchasing commitments, updates pricing on open estimates, and examines crew assignment by project.
Job-level detail changes the decision. A consolidated materials total might suggest a company-wide purchasing issue, while the project breakdown shows separate price and efficiency problems requiring different owners.
Common Pitfalls and Quick Fixes for Better Variance Reports
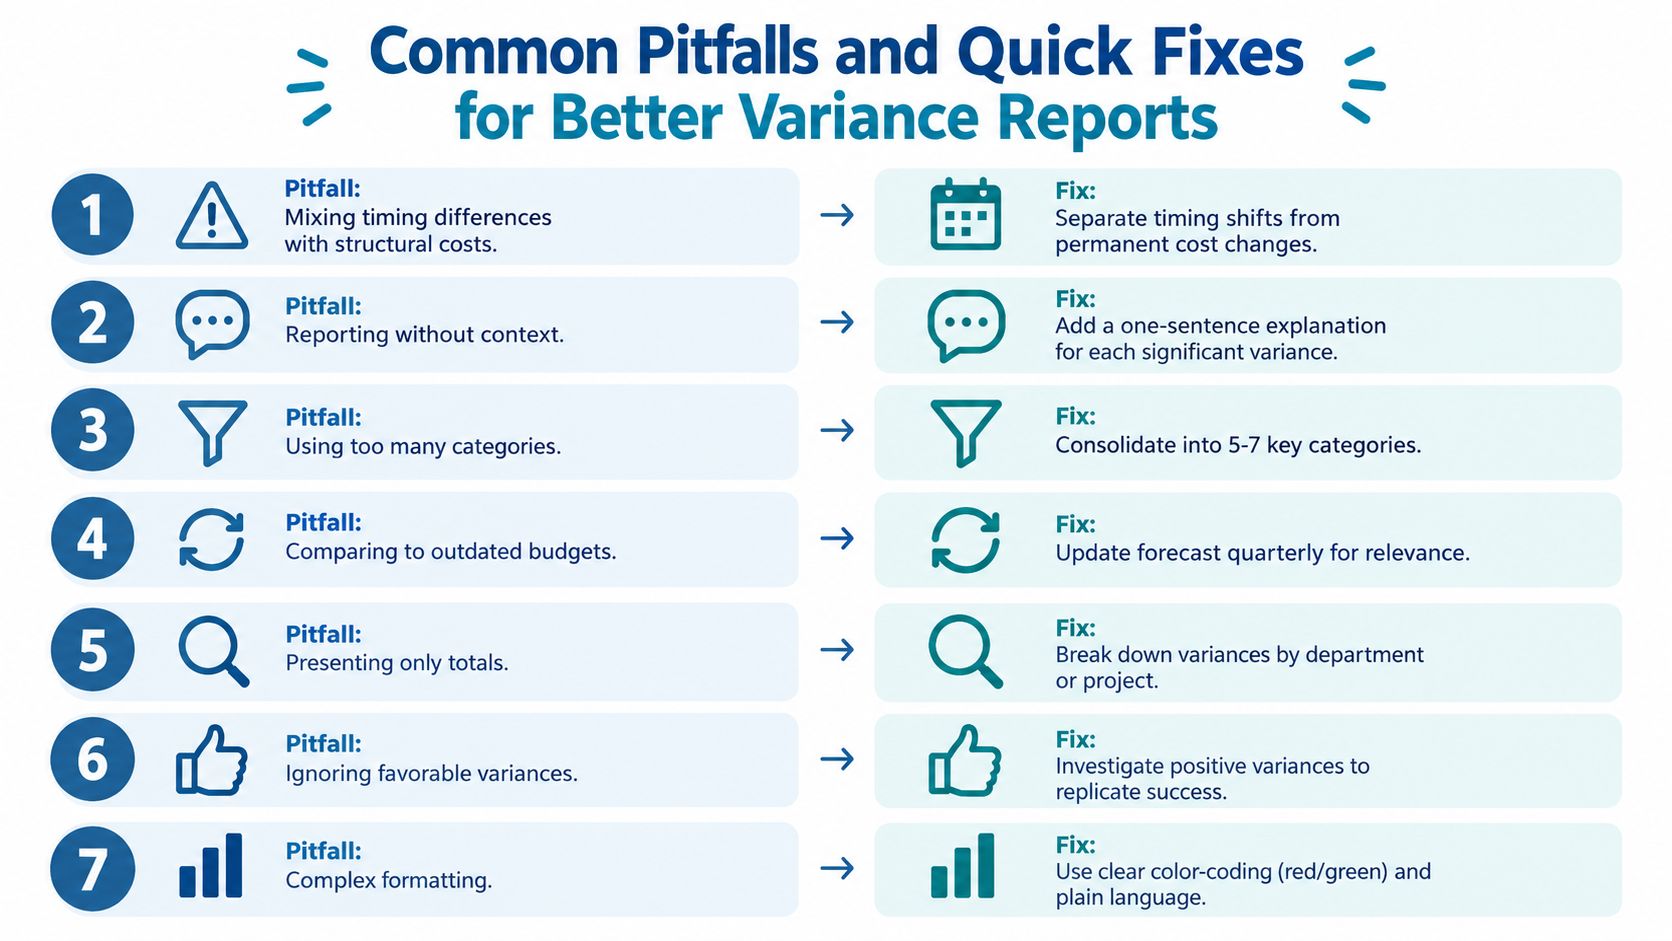
Most weak variance reports don't fail because the formulas are wrong. They fail because the report treats every difference as equally meaningful, compares the wrong periods, or stops at description instead of assigning action.
Audit the process against these recurring mistakes:
- Mixing timing and structural costs: Separate a late invoice or prepaid release from a permanent vendor increase.
- Reporting without context: Add one sentence explaining each significant variance and its operational effect.
- Using too many categories: Consolidate the report into a manageable set of decision-focused categories.
- Comparing with an outdated budget: Refresh the forecast when the business has materially changed instead of treating the original plan as permanent truth.
- Presenting only totals: Break important variances down by department, project, location, or property.
- Ignoring favorable variances: Determine whether a positive result came from repeatable efficiency, delayed spending, lower activity, or an accounting classification.
- Using complex formatting: Keep labels plain, colors consistent, and explanations readable.
Don't let the bookkeeper's delivery end the review
A bookkeeper can prepare accurate reports, but the owner still has to supply business context. The person approving the report should know whether a project started late, a customer delayed payment, a supplier changed terms, or a manager approved overtime. Without that review, the report records differences but doesn't improve decisions.
Timing variances also need separate treatment from permanent or structural variances. A timing issue may correct itself in a later period, while a structural issue can require corrective action, an assigned owner, and follow-up monitoring, as explained in this timing versus structural variance guide.
Before approving the next monthly package, confirm:
- Current baseline: The budget or forecast still reflects the business plan.
- Defined materiality: The report has a documented threshold for commentary.
- Timing notes: Temporary shifts are clearly footnoted.
- Root causes: Flagged lines are classified by price, volume, timing, or mix.
- Written explanations: Each significant difference has a concise cause.
- Assigned ownership: Someone is responsible for the next action.
- Follow-up date: Open items return to the next reporting cycle.
Automation can calculate comparisons faster, but it can't decide whether a roof replacement is capital work, whether overtime reflects growth, or whether a revenue shortfall came from weak demand. Clean actuals, consistent categories, and owner review matter more than an advanced dashboard.
Blue Sage Tax & Accounting Inc. helps owner-operated businesses build reliable monthly bookkeeping, accounting, and reporting processes that turn financial statements into practical decisions. Visit Blue Sage Tax & Accounting Inc. to discuss a variance reporting workflow that fits your business, or Book your free consultation call today.
This article is general information and not tax advice for your specific situation.